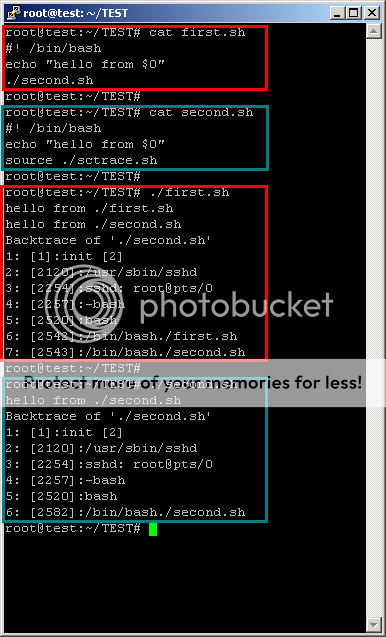
Trace of executed programs called by a Bash script
A simple script I wrote some days ago...
# FILE       : sctrace.sh
# LICENSE    : GPL v2.0 (only)
# PURPOSE    : print the recursive callers' list for a script
#              (sort of a process backtrace)
# USAGE      : [in a script] source sctrace.sh
#
# TESTED ON  :
# - Linux, x86 32-bit, Bash 3.2.39(1)-release

# REFERENCES:
# [1]: http://tldp.org/LDP/abs/html/internalvariables.html#PROCCID
# [2]: http://linux.die.net/man/5/proc
# [3]: http://linux.about.com/library/cmd/blcmdl1_tac.htm

#! /bin/bash

TRACE=""
CP=$$ # PID of the script itself [1]

while true # safe because "all starts with init..."
do
        CMDLINE=$(cat /proc/$CP/cmdline)
        PP=$(grep PPid /proc/$CP/status | awk '{ print $2; }') # [2]
        TRACE="$TRACE [$CP]:$CMDLINE\n"
        if [ "$CP" == "1" ]; then # we reach 'init' [PID 1] => backtrace end
                break
        fi
        CP=$PP
done
echo "Backtrace of '$0'"
echo -en "$TRACE" | tac | grep -n ":" # using tac to "print in reverse" [3]
... and a simple test.

I hope you like it.
~$ help caller
caller: caller [EXPR]
    Returns the context of the current subroutine call.

    Without EXPR, returns "$line $filename".  With EXPR,
    returns "$line $subroutine $filename"; this extra information
    can be used to provide a stack trace.

    The value of EXPR indicates how many call frames to go back before the
    current one; the top frame is frame 0.
You can use Bash Debugger http://bashdb.sourceforge.net/
Or, as mentioned in the previous comments, the caller bash built-in. See: http://wiki.bash-hackers.org/commands/builtin/caller
i=0; while caller $i ;do ((i++)) ;done
Or as a bash function:
dump_stack(){
    local i=0
    local line_no
    local function_name
    local file_name
    while caller $i ;do ((i++)) ;done | while read line_no function_name file_name;do echo -e "\t$file_name:$line_no\t$function_name" ;done >&2
}
Another way to do it is to change PS4 and enable xtrace:
PS4='+$(date "+%F %T") ${FUNCNAME[0]}() $BASH_SOURCE:${BASH_LINENO[0]}+ '
set -o xtrace    # Comment this line to disable tracing.